Why use z-score analytics? The simple answer is “to standardise and compare differently scaled metrics”. Let’s have a simpler reality check (and definition) and look at that in real terms.
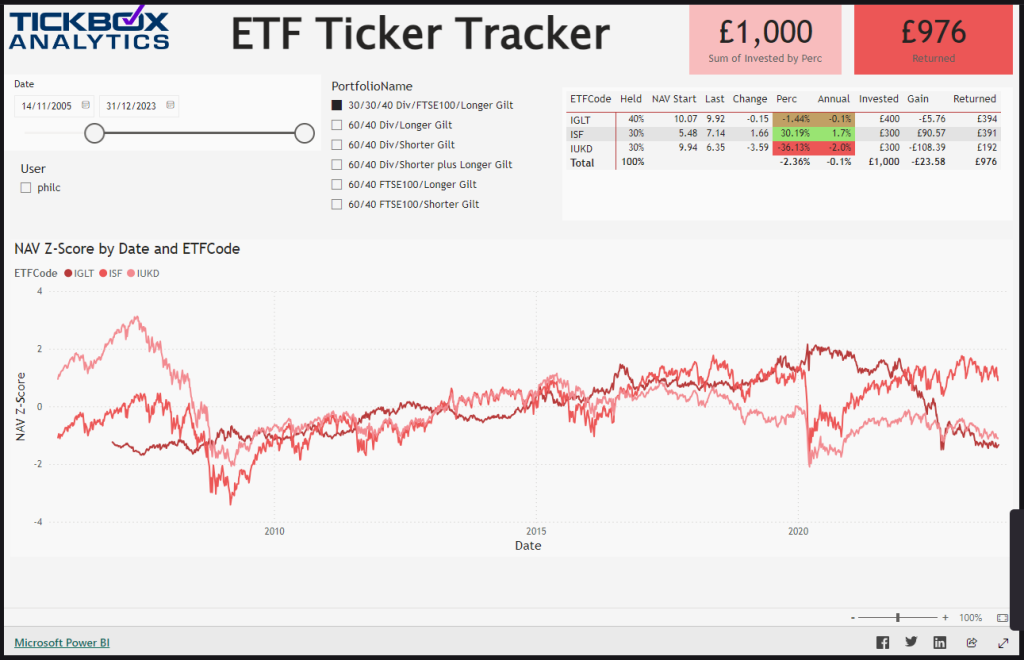
We can use our live ETF Ticker Tracker useful for comparing ETFs with completely different pricing scales. One may be £2 per share, the other may be £17.87 – so you can’t merely add them both to the same chart without some kind of re-scaling.

Note that these metrics are all in pounds sterling, but in fact, the measures themselves can be completely different as well as just scale – e.g., rainfall mm compared to temperature centigrade, sunlight W/m^2 etc.
Z-Score Analytics Dashboards
Once the Z-Scores are calculated they can be presented – but this often needs to be done within the presentation or BI Dashboard itself, in order to calculate within the selections and filters made by the user. For example, selection of the metrics themselves (in this case, each ETF Fund or group), date filters etc.

Now we can see our standardised metrics in full context, re-selecting or zooming in and out – to focus on segments of interest. This is where the real power of dynamic z-scores come in – rather than pre-calculated static values. Imagine the storage and management required to hold sets of z-scores by date for every combination! But in our dashboard, they’re calculated on the fly and displayed for analysis – thanks to the power of DAX when using Power BI.
DAX in Power BI
The beauty of DAX (Data Analysis eXpressions) is what gives Power BI it’s… power. Although writing complex nested expressions can be more an art than a science – think chained Excel formulas but in 3 (or more!) dimensions instead of 2. But that’s what we do so you don’t have to. Just drop us a line!


