Back
BI Analytics

Power BI Live: KPI Tracker for Health Groups

Update metrics directly in SQL Spreads

Below is a live interactive Power BI KPI dashboard for group hospital management of bed, patient and staff weekly values. Random data was generated using a normal distribution adjusted for winter increases of patient levels, but can be created and updated with SQL Spreads for Excel.

Click the “Regions” mini bar-chart to filter the hospital grid and KPI cards. Patterns to be verified with the line charts (hover over them for hospital names and values) and metrics grid. The grid icons show KPI target icons (green ticks and red crosses) for issues – additional orange flags or similar could be added to show warning levels too, eg. approaching 85% occupancy. Drill-through by right-clicking any hospital name for a new screen with further detail and background values. KPI’s are recalculated by the Week slider which can show ranges or individual weeks (eg. last period).

Drill-through is enabled by right-clicking any hospital name, showing a new screen with further detail and background values for that selection. But most information can be quickly gained from this overview screen, so not much fiddling by management users is required and comparisons are easier.


Requirement

Provide interactive BI on weekly KPI data (hospital beds, staff and patient levels) edited by SQL Spreads Excel add-in.

Delivered

Power BI KPI dashboard including autogenerated test data with adjusted random normal distribution.

Frontend

Power BI & SQL Spreads

Middleware

DAX & T-SQL

Backend

SQL Server (cloud and on-prem)

Some Basic Analysis

The winter curve can be easily seen on the “Bed Occupancy” multi line chart even with the random noise. Spikes can still be seen though, especially if above the target line of 85%. Hovering mouse over (on the live one linked) reveals the sources for further investigation. 

An inverse relationship can be seen on “Staff to Patients” below it, showing the 25% KPI target is breached during summer. That’s because the staffing levels remain fairly static throughout the year, as can be seen on the “Total Staff to Patients” in top right chart. This could be the basis for less permanent staff to be recruited over winter. 


How we can help you?

We love building data solutions for organisations who can make the most of their potential.

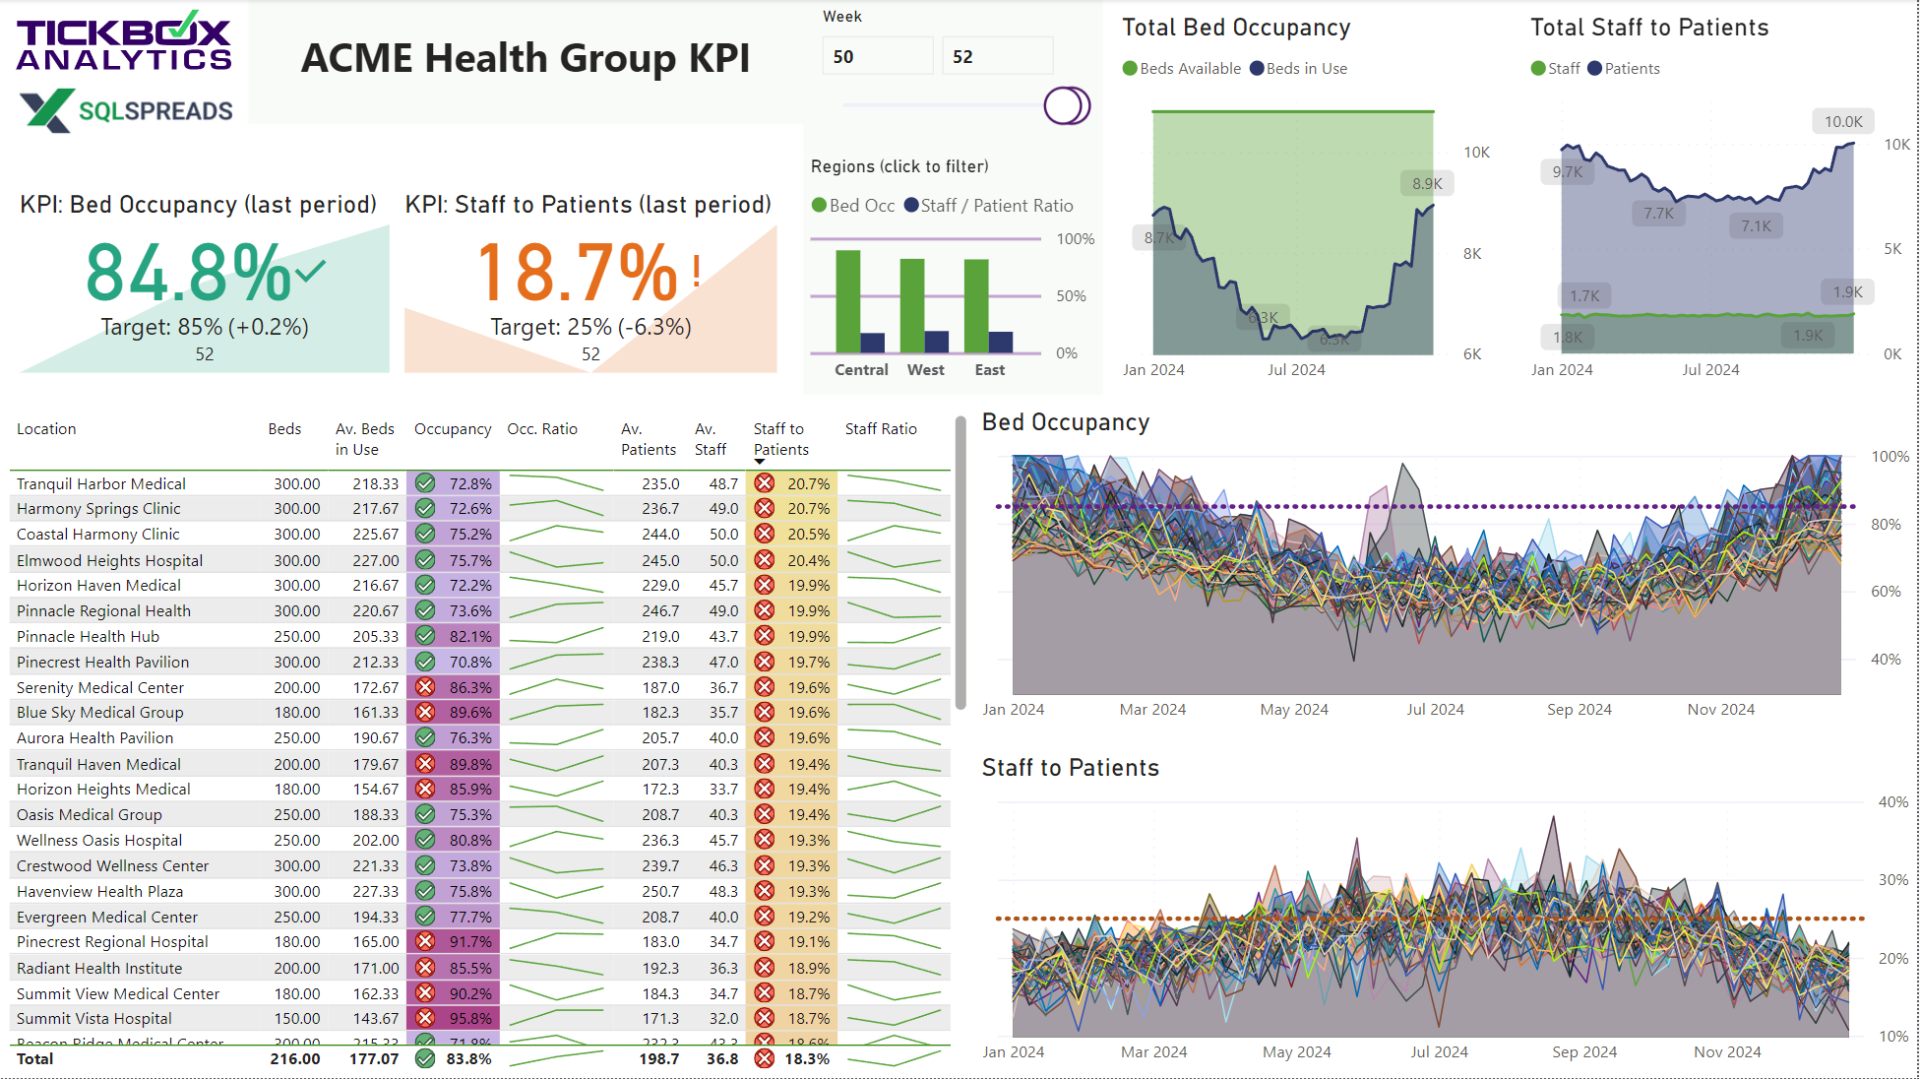
Power BI KPI Tracker for hospital group management, fully updateable with SQL Spreads Excel add-in.

Leave a Reply

Your email address will not be published. Required fields are marked *

This website stores cookies on your computer. Cookie Policy